ClrMD part 2 – From ClrRuntime to ClrHeap or how to traverse the managed heap

The second post of the ClrMD series where I’m detailing how to detect string duplicates has been published on the official Criteo blog!

Feel free to follow me there if you are interested in how to write your own tool with ClrMD: you will get sample code around strings, timers, thread pool and much more.

I hope this helps

Posted in .NET, Development, Tools | Leave a comment

Starting a new series about ClrMD

Today, my first post about ClrMD has been published on the official Criteo blog!

Feel free to follow me there if you are interested in how to write your own tool with ClrMD: you will get sample code around strings, timers, thread pool and much more.

I hope this helps

Posted in Development | Leave a comment

Tool update – LeakShell 1.4.2

Download LeakShell 1.4.2 x86|x64

I’ve been using LeakShell in my new job at Criteo and I got errors due to large numbers in objects count and size. In the early 2010s when I wrote LeakShell, most of the needs were related to x86 processes. This time is over… for a long time!

The code has been updated to use long instead of int for the objects count/size and the result is available now.

I hope this helps

Posted in .NET, Development, Memory, Tools | Tagged | Leave a comment

KernelLeakShell update

Download Kernel Leak Shell v1.2

As I was preparing an internal demo @Microsoft, I realized that KernelLeakShell had a bug if handle.exe was not present. It should be fixed with this update with a better check and by including the last version of the tool from SysInternals.

I hope this helps

Posted in Development, Tools | Leave a comment

Kernel Leak Shell and automatic elevation

Download Kernel Leak Shell v1.1

The original version of Kernel Handle Leaks Shell has a frustrating feature: you have to explicitely start it elevated or the same error message will pop up all the time
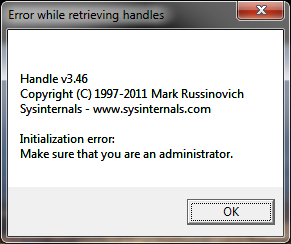
because handle.exe that it executes behind the scene will not have the required privileges.

An UAC discussion is far beyond the scope of this post but feel free to read the related pages in chapter 4 of Windows via C/C++ for a complete coverage.
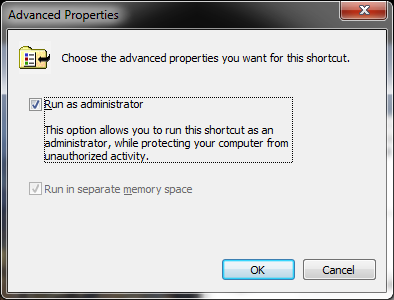
If you don’t want to right click on the executable and pick the Run as administrator item all the time
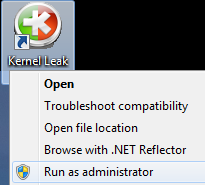
you could use Windows shortcut settings.

You have two choices: either via the Compatibility tab
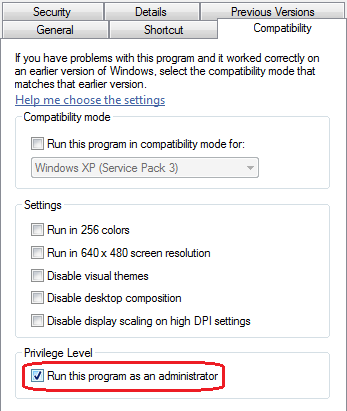
or via the shortcut tab

Both solutions are working and you’ll always get the elevation prompt. Note however that the icon won’t show the elevation shield official UI hint.

expected UI hint

So… How to let the tool be automatically elevated by Windows when it starts and get a nice shield hint?

As explained in Create and Embed an Application Manifest (UAC), the answer is simple: you need to associate/embed a manifest with the right information to the executable. Unlike what is detailed in the MSDN page, the embedding process becomes really easier with Visual Studio 2010 because you don’t need to mess up with post build step in order to call mt.exe.

First, you add a manifest to the application if not already there. Right click on the project and Add|New Item…|General|Application Manifest File

Second, set the requestedExecutionLevel.level attribute to “requiredAdministrator” instead of the default “asInvoker”.
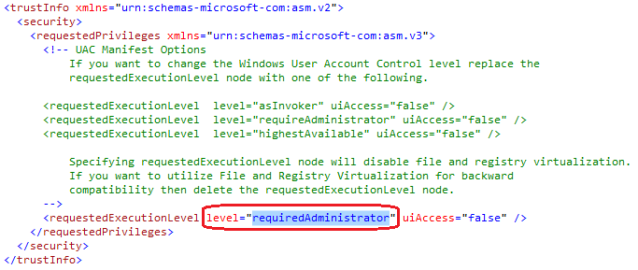
Third, build the application. And… That’s it!

I hope this helps

Posted in .NET, Development, Tools | Tagged , | Leave a comment

Tools updates

Download SAD v1.3.2 x86|x64
Download LeakShell v1.4.1 x86|x64

I’ve got bad feedbacks when using SAD or LeakShell without the right environment variables set or LeakDiag not installed. Therefore, I’ve updated both tools to warn their users accordingly.

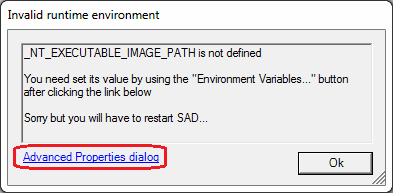
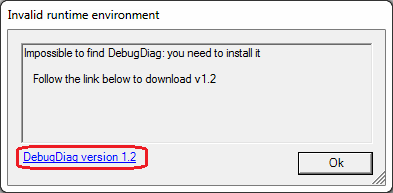
For SAD, the situation is simple: without LeakDiag or symbols/binaries environment variables set, there’s no hope. So, before the main window is shown, I’m checking for both conditions and try to help fixing the issue:

  • Environment variables: I’m helping by providing a link that starts the system dialog from where they can be set. Unfortunately, you need to restart SAD because there is no easy way (is there one?) to check the change through the process environment block that has not been updated.
  • LeakDiag installation: the link to the Microsoft download page is clickable and if you install it before clicking the Ok button, SAD will start normally.

I hope this helps

Posted in Development, Tools | 4 Comments

SAD and debugger extensions

Download SAD v1.3 x86|x64

After using SAD for a while, it becomes clear (thanks Olivier ;^) that a couple of small misbehaviors are limiting its real life usage.

  • Error checking has been enhanced to find out what are the issues when a dump file is loaded (if _NT_EXECUTABLE_IMAGE_PATH not set or DebugDiag is not installed for example) in order to help you figure out what is really the problem and how to fix it.
  • One of the first features is to cache the result of each debugger/extension command in order to be much faster and have a dedicated separate result window. However, in some cases such as changing the current thread with ~[ThreadID]s or see the list of loaded debugger extensions via .chain, you need to force the command to be reexecuted. This is now possible by using CTRL+RETURN instead of just RETURN.

Don’t forget that it is possible to also delete a command by selecting it and pressing the DELETE key.

  • I’ve added the support for dragging and dropping a .dmp file both on a shortcut to SAD on your desktop (by expecting a .dmp filename on the command line) and also into the UI of the main window once started.


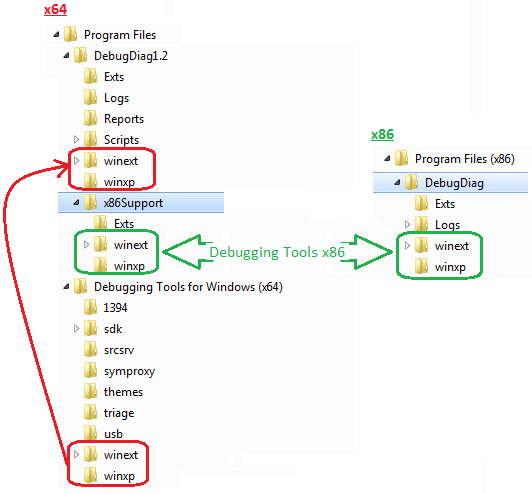
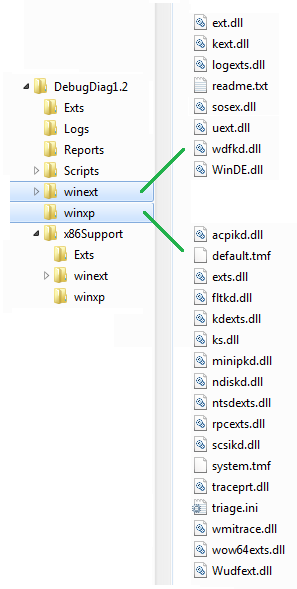
To finish this post, I would like to provide some details about how to use debugger extensions other than SOS. Basically, DebugDiag has its own search path for extensions based on subfolders. Therefore, you must copy folders and files from WinDBG into DebugDiag installation folders; with differences between 32 bit/64 bit cases both for Windows and DebugDiag versions.

Here is the list of extensions in each folder:

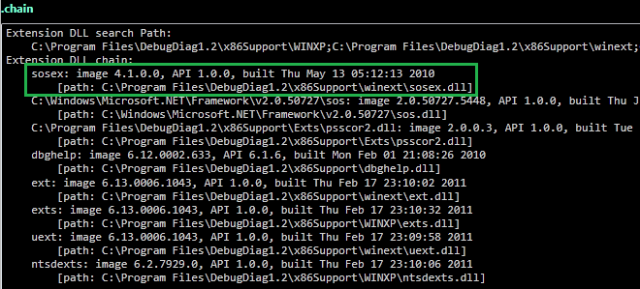
For example, if you type .load sosex, the .chain command will show from where it has been loaded:


If you have found other flaws or particular needs, feel free to leave a comment.

I hope this helps
Posted in Development | Leave a comment

Use SAD to view RCWs and CCWs

Download SAD v1.2 x86|x64

The first tool extension for SAD is about COM.
When you need to call COM objects methods from .NET code, the runtime creates for you R(untime) C(allable) W(rappers) to hide all the complexity behind this kind of communication and lifetime management. On the opposite, when your native code calls methods from .NET components presented as COM objects, the runtime also creates kind of proxy objects named C(om) C(allable) W(rappers).

In both case, you might need to ensure that your code handle the lifetime of such wrappers the right way (maybe playing with ReleaseComObject sometimes). To sum up, you need to know which COM objects are still refusing to self-release behind a RCW or how instances of .NET types are still referenced by CCWs. This is exactly what the « COM Analysis » tool does in SAD.

When you click this menu, a new window appears that parses the output result of sos!syncblk -all.

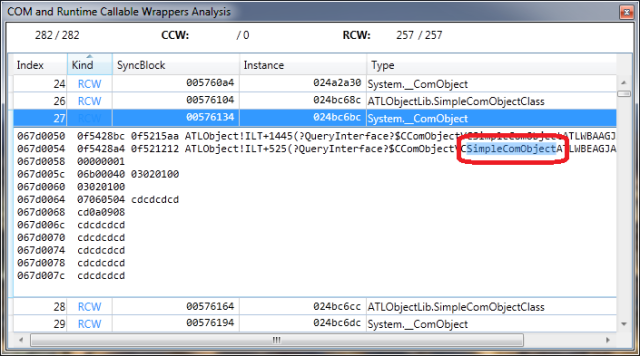
At the end of the analysis, the identified RCWs and CCWs are listed. If you click on a RCW line, you get a dump of the first addresses in the vtable of the corresponding COM object. Since the version 4.0 of the runtime, you always see __ComObject instead of the generated proxy class with a name that could help you figure out which COM object has been instanciated. As you can see,

you still get the vtable details even for__ComObject.
Note that you should have setup the symbols for your COM objects if you want to see meaningful names instead of just the name of the DLL where the COM objects are implemented.

The CCW case is even simpler since the type name and the reference of the .NET instance wrapped by a CCW appears in the right handside of the line

References:

I hope this helps.

Posted in .NET, Development, Tools | Leave a comment

How to find kernel handles leaks

One of my customers was looking for a way to find out if an application was leaking kernel objects or not during specific worklows. The first tool to look at is the Swiss knife ProcessExplorer from SysInternals.

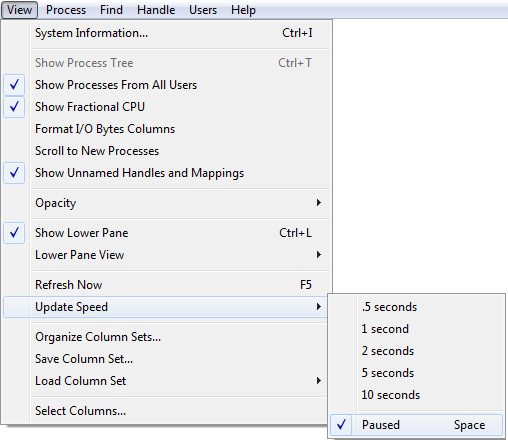
When you select a process, the lower pane lets you see which kernel objects has been created with a lot of informations such as their handle, type and details. So, how to use ProcessExplorer to identify a leak? Simply by stopping the automatic refresh

and pressing the F5 key to refresh the kernel objects list. When a new object is created since the last refresh, it appears in green

or  it appears in red when it has been closed

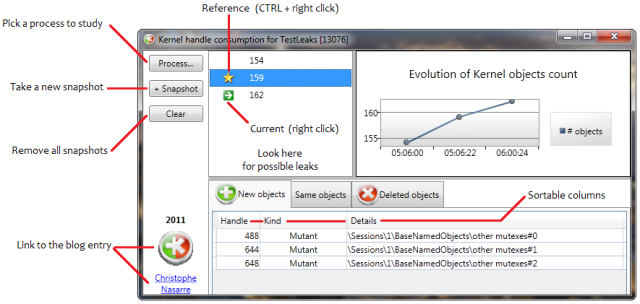
However, this green/red dance does not support more than one comparison ara a time and it is not possible to keep track of the different snapshots along the way. This is why I’ve written Kernel Handle Leak Shell. This tool share many features with LeakShell that helps you find out which instances of managed types stay referenced over time:

  • take snapshots of kernel objects consumption at will
  • show the kernel objects count evolution in a graphical way
  • define new reference and current snapshots to trigger a comparison

but also bring new ones such as :

  • select a process to study
  • see the New, Same and Deleted objects between two snapshots
  • sort the lists by handle, kind or details
  • see the handles for a given snapshot by double-clicking it in the list
 

The engine used by this tool to list the kernel objects of a given process is handle.exe, another executable provided by Mark Russinovich on SysInternals. I’m simply redirecting the output of this console application into a string before parsing it to build my own internal list of kernel objects.

Download KernelLeakShell 1.0

The only prerequisite is to download handle.exe from SysInternals on top of the .NET Framework 4.0 for the DataGrid and the WPF Toolkit (included into the downloadable .zip) for the chart.

References:

I hope this helps.

Posted in Development, Tools | 2 Comments

LeakShell 1.4 – Use the dumps Luke!

After the first release of LeakShell, here is an update that allows you to directly provide dump files .
This evolution is based on what I’ve presented to control a debugger engine and send commands to the sos.dll extension.

You’re still able to use LeakShell as you do your investigation within WinDBG but also post-mortem based on dumps of the application takens at different time while memory is growing: you just have to drag the .dmp files to the snapshot listview on the upper left side of the application.

As with S.A.D., you need to use the right version of LeakShell: the x86 version for 32 bit dumps or the x64 version for the 64 bit dumps.

Download LeakShell 1.4 x86 | x64

The only prerequisite is to install DebugDiag x86 | x64 on top of .NET Framework 4.0.

Posted in .NET, Development, Memory, Tools | 2 Comments