I’m assuming that the notion of memory leak in .NET is clear but if it is not, you should read Identify And Prevent Memory Leaks In Managed Code by James Kovacs and the recap of GC behaviors by Jeffrey Richter in Part 1 and Part2.
When a memory leak has been identified through TaskManager, PerfMon, ProcessExplorer, System.Diagnostics.Process.PrivateMemorySize64 or System.OutOfMemoryException, it is time to find out what instances are still referenced while they should not and by which object(s).
This post focuses on the first part of the investigation : what instances are stuck in gen2 part of the managed memory.
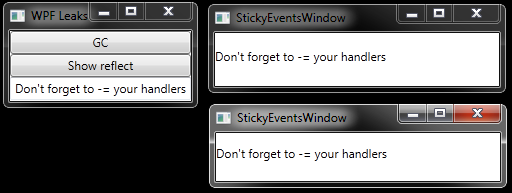
I’ve used one of the leaks examples given in Finding Memory Leaks in WPF-based applications to write an application where objects are still referenced even one might think they are not.

As you might guess, when a StickyEventsWindow gets closed, it stays in memory due to incorrect event registration.
Rico Mariani provides a simple and efficient way of Tracking down managed memory leaks (how to find a GC leak). The idea is to use sos.dll and a debugger to list the objects managed by the GC.
When you investigate a memory leak, you are either lucky enough to reproduce it in your developpement environment or on production machines far far away. In the former case, you can attach your debugger to the application. In the latter case, you’ll ask the administrator to capture dumps of the application. For more details about the 666 ways to take a minidump, take a look at How to Capture a Minidump: Let Me Count the Ways by John Robbins.
In both cases, you end up using sos commands. Let’s follow the usual steps:
- Load the sos.dll extension
.loadby sos mscorwks (for .NET 2/3.0/3.5).loadby sos clr (otherwise) - List the objects in generations, sorted by size
!dumpheap -stattotal 0 objectsStatistics:
MT Count TotalSize Class Name
6cc45b70 1 12 System.Collections.Generic.ObjectEqualityComparer`1[[System.Type, mscorlib]]
6cc44d7c 1 12 System.Security.Permissions.ReflectionPermission
6cc44c98 1 12 System.Security.Permissions.FileDialogPermissiont
…
6cc38140 699 53124 System.Threading.ExecutionContext+ExecutionContextRunData
005ca200 155 58744 Free
6cbf6de0 792 123740 System.Object[]
6cc3fb64 3242 129056 System.String
Total 25368 objects
At that point, we have the state of the application in term of allocated objects. We need to wait for more objects to be created an take another !dumpheap -stat snapshot but with leaked objects.
The painful process is to compare the two snapshots. Here is one solution:
- copy and paste special one list into Excel to project the MT, Count TotalSize and Class Name into columns
- sort the columns by MTNote that it is possible to have instances of the same ClassName for two reasons: same type in different AppDomain and differents types from different assemblies. Only the Method Table address is the key to distinguish CLR types.
- save into a .txt file
- windiff two files to see the differences
However, the differences might end up with a lot of noise:
- not interested in count reduction
- often not interested in types from the BCL but by our own type only
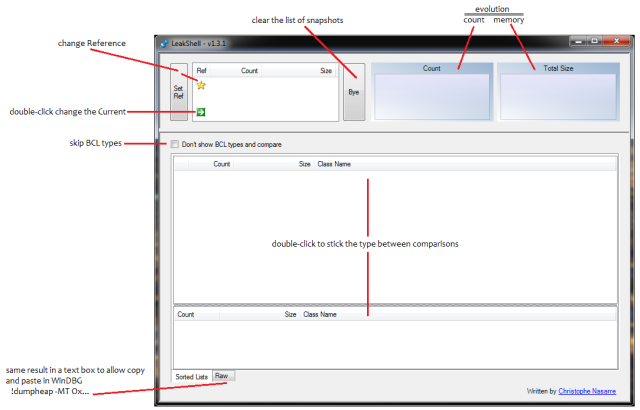
I decided to build a tool to compute these steps for me and voila: LeakShell was born. It automatically intercepts the copy to clipboard in text format that contains “!dumpheap -stat”, sort it by MT and add it into a collection of snapshops that you can compare one against the other.
Once you’ve identified the types of the objects with a count that keeps on increasing, it is time to take a look at your code. Well… you can also keep on investigating with sos.gcroot but it is a nightmare even if you use John Robbins trick to jump from address to address with a mouse click.
Another more graphical solution is to use CLRProfiler. But… how to bridge between the debugger and CLR Profiler? Use sos.traverseheap Luke! as explained by the integrated help:
!help traverseheap
——————————————————————————-
!TraverseHeap [-xml]
!TraverseHeap writes out a file in a format understood by the CLR Profiler.
You can download the CLR Profiler from this link:
It creates a graphical display of the GC heap to help you analyze the state of
your application. If you pass the “-xml” flag, the file is instead written out
in an easy-to-understand xml format:
…
You can break into your process, load SOS, take a snapshot of your heap with
this function, then continue.
Read NET Best Practice No: 1:- Detecting High Memory consuming functions in .NET code by Shivprasad koirala for more details about how to use the CLR Profiler.
Please feel free to post your comments about how to improve LeakShell.
I can’t promise that I’ll implement everything but… who knows?:^)
Other References:
- How to detect and avoid memory and resources leaks in .NET applications in english and french : very complete articles with tools and samples (even covering the case of GDI leaks I’ve discussed a long time ago in MSDN Magazine :^)
- Inspect and Optimize Your Program’s Memory Usage with the .NET Profiler API by Jay Hilyard.
- Best Practices No 5: – Detecting .NET application memory leaks.
- Investigating Memory Issues by Claudio Caldato and Maoni Stephens.
- Memory Leak Detection in .NET shows how, thanks to sos.dll commands, to detect leaks but also how track down what objects are keeping a reference to another object.
- Last but not least on MSDN.
CLR Profiler download links:


Do you mind specify legends on the two graphs at the top of the UI ?
Thanks.
Julien
Thanks for the feedback Julien.
I’ve uploaded a new version 1.3.1 that contains your request
+ remove the “Compare” button because just re-comparing at check box change is enough
+ change the default List view at the bottom of the screen
Pingback: How to control a debugger engine? | Code & Debug
Very nice and lightweight if you dont have a full profiler at hand.
Thank you very much 🙂
Dominik
Thanks Dominik :^)
Don’t forget to get the latest version from https://codenasarre.wordpress.com/2012/01/06/tools-updates/